FP&A Modeling Best Practices
A detailed guide to the best practices when working with FP&A models, budgets, and forecasts
What Makes FP&A Different?
Financial planning and analysis (FP&A) is a crucial role in any organization. FP&A teams perform budgeting, forecasting, and analysis to support key decision-makers, ensuring that senior leaders have the most up-to-date information and knowledge.
However, an FP&A role at one company can be quite different from a similar role at a different company. In fact, financial planning differs from company to company, industry to industry, and from small businesses to large corporations.
Even similar-sized companies in the same industry may have significant differences in FP&A roles and functions. For example, Company A may have an entire FP&A team dedicated to analyzing and forecasting headcount and a separate team focused on revenue. In contrast, Company B might have one, single FP&A team that performs all financial analysis and forecasts and analyzes both headcount and revenue.
Some FP&A roles might even involve valuation and evaluating acquisition opportunities, which normally fall under the purview of the corporate development team. Some companies do most of their financial planning and analysis in Excel, while others have special FP&A software to help with planning.
Because of these significant differences, FP&A modeling best practices are extremely difficult to develop and implement. This is a common pain point for just about anyone in FP&A. However, we’ve come up with some key modeling best practices that can be used in any FP&A role, no matter the organization.
Key Highlights
- FP&A at one company can be quite different from a similar role at a different company. This makes developing FP&A model best practices more difficult compared to more “standard” models like a discounted cash flow model.
- Despite that, there are still some universal best practices that can enhance and speed up any FP&A process.
- We discuss universal best practices around model design, versioning and archiving, periodicity, file sharing, and dealing with external data.
Types of FP&A Models
Regardless of type, all FP&A models and analyses need to be able to be easily updated, dynamically report on performance and key performance indicators (KPIs), as well as illustrate multiple scenarios so management can thrive in a changing, future business environment.
Given the diversity of FP&A roles, let’s first discuss some of the most common models an FP&A professional may work on.
- Three-Statement Model: A three-statement model links the main financial statements (income statement, balance sheet, and cash flow statement) into one dynamically connected financial model. Three-statement models are the foundation on which more advanced financial models are built, such as discounted cash flow (DCF) models. The three-statement model may be created at the business-unit level, or it may be the ultimate financial statement model at the parent-company level.
- Detailed Operational Model: Again, this can be wildly different between different organizations but at a high level, an operational model is a highly detailed, “bottoms up” model that consists of both financial metrics and non-financial metrics. As mentioned earlier, some organizations will have teams solely focused on one aspect of the business, like revenue. In this case, the operational model will consist of a revenue forecast by individual product or SKU number. This model might also contain an accounts receivable aging schedule or other analysis to help management monitor progress and set targets. Other operational models might be headcount and salaries, or salespeople and sales quotas.
- Project Budget Model: A project budget is used to estimate the total cost of a project or investment. As part of this, there may also be calculations regarding the investment’s net present value (NPV), internal rate of return (IRR), or payback period.
- Cash Flow and Financing Model: This model tracks a company’s generation and usage of cash. This is absolutely crucial because a company must understand its current and expected cash flow so that it doesn’t get into a scenario where it can’t pay its bills. As part of this type of model, the company can project if it needs to raise cash, usually via debt or equity.
Regardless of model type, it’s important to consider the following issues, which we’ve identified as significant pain points from our own experience and when speaking with industry practitioners.
FP&A Model Best Practices
Upfront model design is a critical part of the modeling process
When building a model or analysis from scratch, it’s common to start with the inputs and then work linearly through the model to the outputs. However, we do not recommend that approach.
Instead, we suggest beginning the process by asking what will the model be used for? What decision are we trying to make that the analysis may help us with? What questions do we have that the model could answer? These types of questions define what we need the model to do, and it gives us a better roadmap for how the model should be designed.
Therefore, we recommend thinking about the model outputs first and then backward solving for the necessary inputs.
Using visuals and dashboards for communication
Since we recommend starting with the outputs first, we can also decide on the best visuals to communicate those outputs. Since a model is ultimately just a decision-making tool, we really only need the model to communicate the main points to the executive team. The executive team is not going to want to look through all of the minutia, but they will want to see well-designed charts and exhibits that can quickly tell a story.
Our dashboards course designed for FP&A professionals covers some nice visuals that can easily be updated to see how a company is performing to budget and forecast.
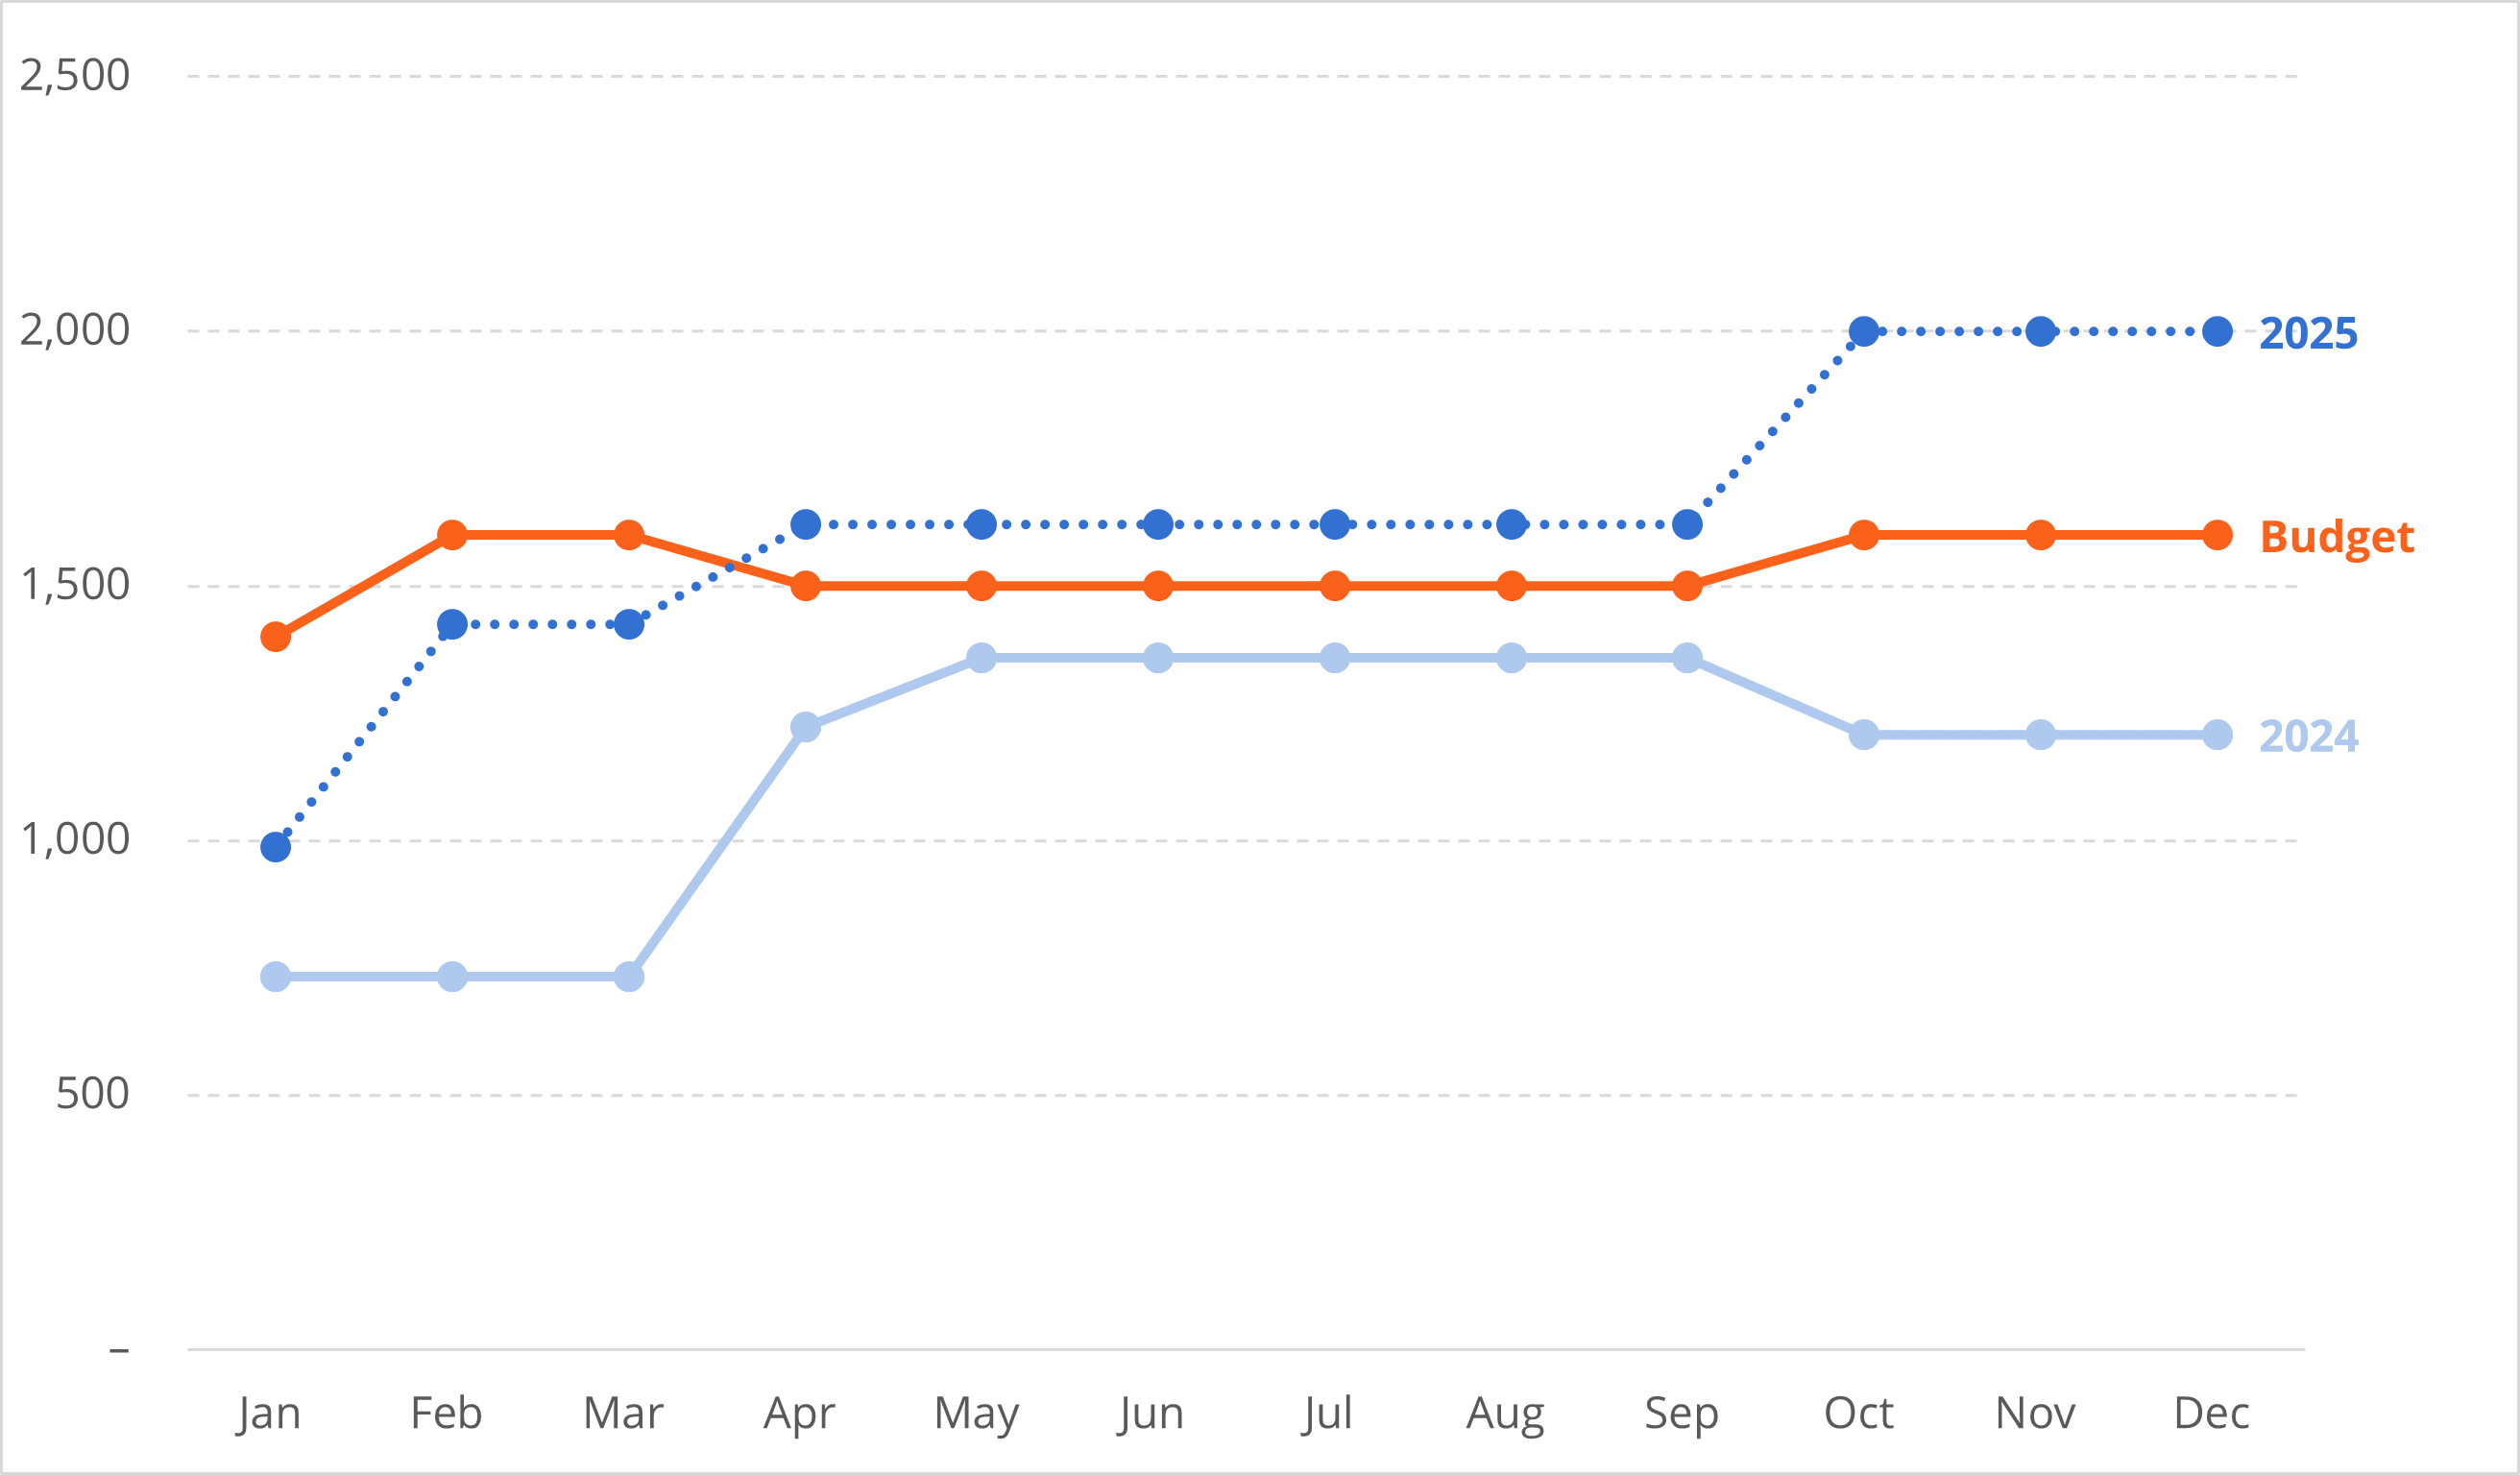
Image from CFI’s FP&A Professional Dashboard Visualizations & Analysis course
Periodicity in models
Another important attribute to consider when discussing model structure is periodicity. Periodicity refers to the frequency of the intervals in the model. As a part of the design process, we need to consider whether to build a monthly, quarterly, or annual model.
Regardless, it’s a best practice to design the model at the most granular period, usually monthly for FP&A models. The results of the monthly model could then be easily aggregated into quarters or years, something we cover in our Financial Statement Aggregation course.
Additionally, we feel it’s important to avoid mixing the periodicity across adjacent columns. What we mean by this is that the best design has nothing but months across columns. If we need to summarize by quarter or by year, we don’t want to insert those summation columns into our monthly model. Instead, it’s better to have the summation on a different worksheet.
![]()
Source: CFI’s FP&A courses
File sharing
One of the most time-consuming elements of FP&A is the budgeting process. The budget process can take several months at large organizations and requires feedback from many different teams and stakeholders. As part of the budgeting process, it’s common for financial planning and analysis professionals to send files out to different departments like marketing, operations, and sales. The FP&A team must then receive and compile all of these files into a workable budget model.
One way to help expedite this task is by sending pre-formatted, protected files to the different departments. The file protection prevents different teams from modifying crucial parts of the file, which would necessitate a lot of time for a corporate financial analyst to review and fix.
There are several different ways to protect Excel files. The first way to add protection in Excel is by protecting the entire file or workbook with a password. This means that the file cannot be opened at all without the correct password.
A less draconian approach is to allow users to open the file without a password but does not allow users the ability to change the file, aside from the ability to enter data into a pre-selected number of cells. The benefit of this approach is that the FP&A team can design a budget model that incorporates information from various departments but eliminates the time-consuming task of fixing or hunting through a file that has been completely edited (or created from scratch) for the necessary data. The downside is that this requires a lot of consideration and time to set up.
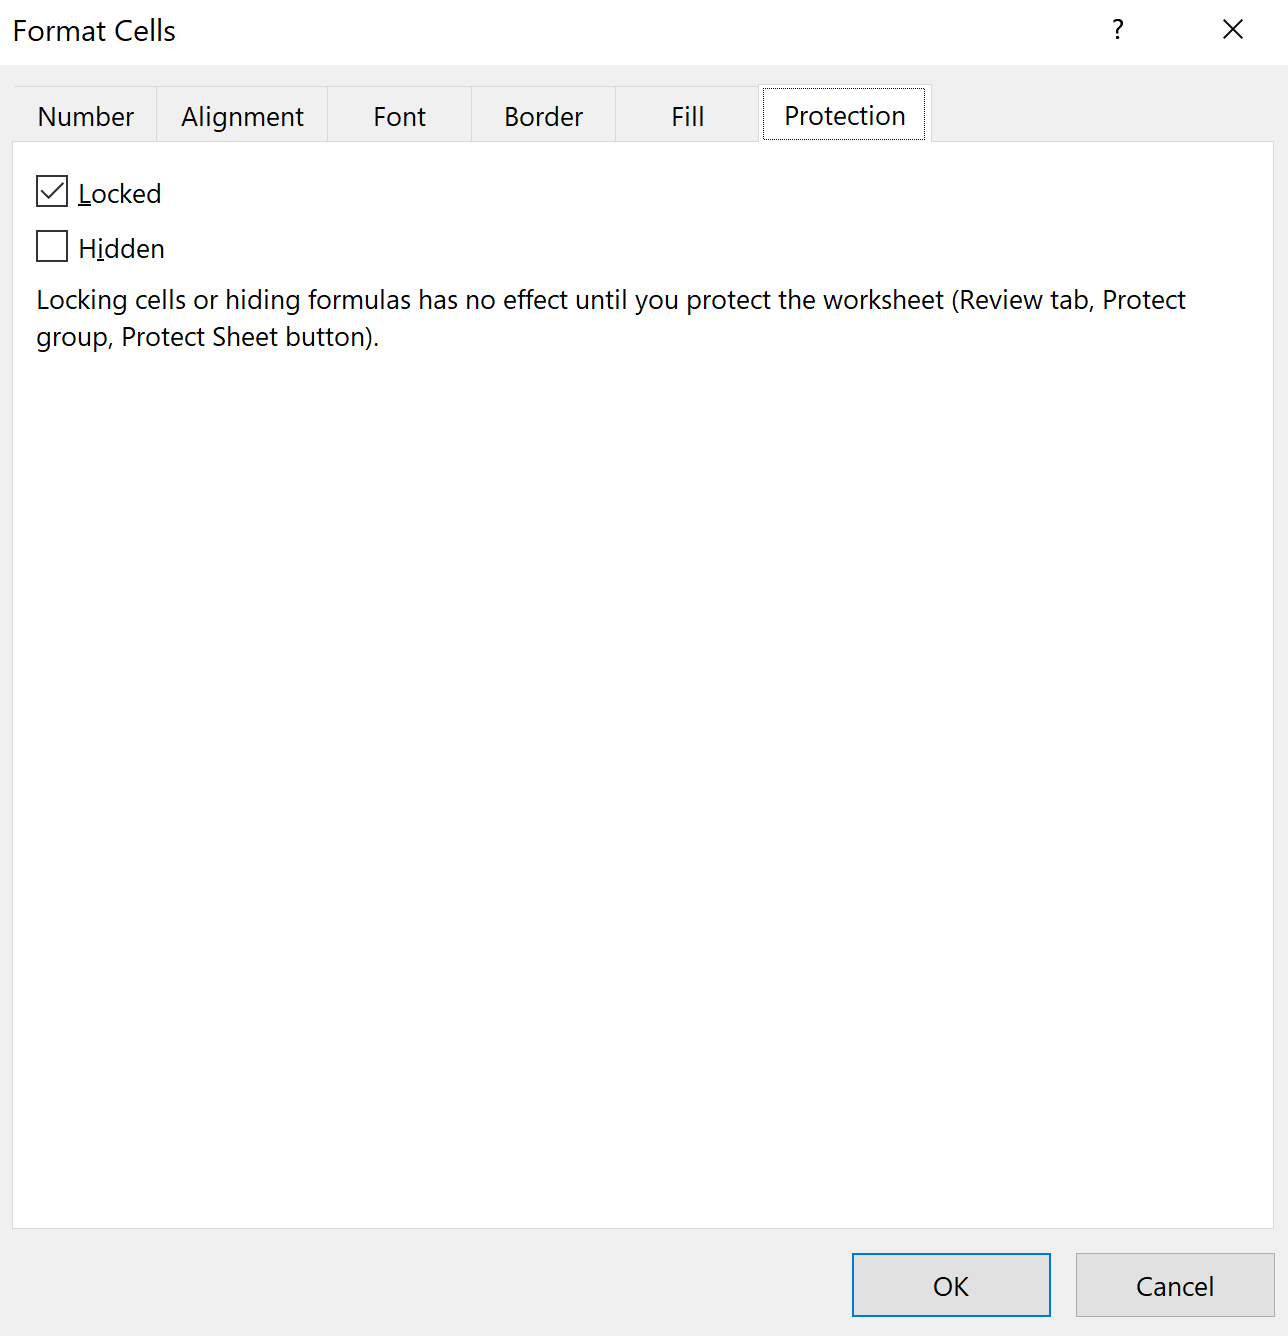
Excel Format Cells dialog box
If you choose to set up this level of protection, you must first select the cells you want to unlock. By default, Excel will lock all cells once the Protect Sheet functionality is enabled. Therefore, you will need to select the specific cells that you want unlocked. This will allow the user the ability to input numbers or formulas in the unlocked cells.
Once you’ve decided on the setup and unlocked the proper cells, you can then protect the appropriate worksheet in Excel by going to Review on the Excel ribbon and selecting Protect Sheet.
Once there, you have multiple different options you can select.
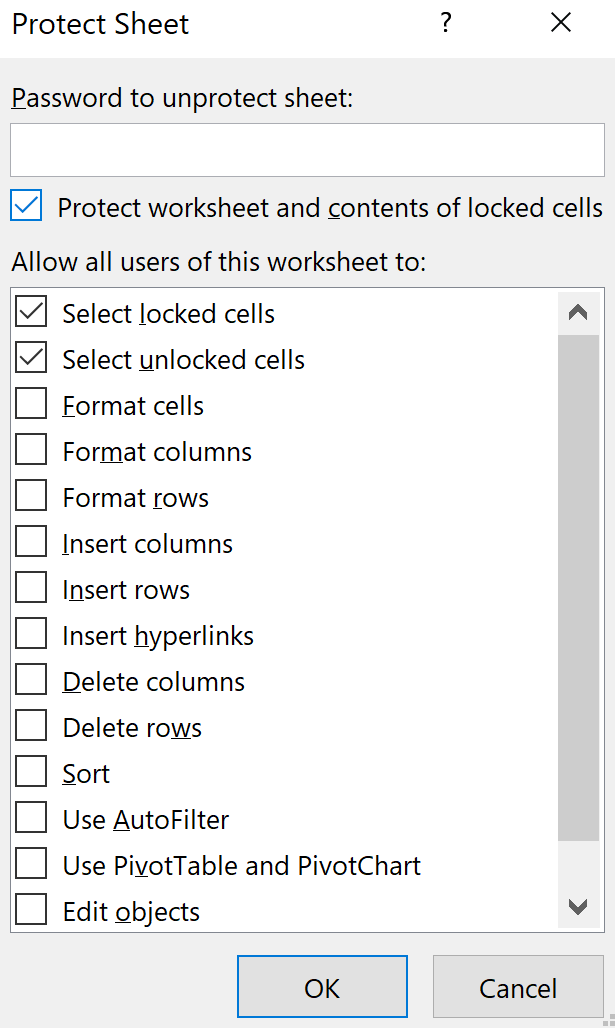
Excel Protect Sheet dialog box
Depending on your preferences, you might not want the user to be able to select locked cells. If so, simply uncheck the “Select locked cells” check box. If this is the case, the user will only be able to select specific cells that require inputs, which helps the FP&A team save time since they don’t have to go through multiple files and figure out where the usable data actually is.
Modifying existing files
Since FP&A models can be so different, even between similar companies and industries, it’s common for a new FP&A analyst to just build off of a legacy model. What happens then is that this keeps happening over and over, and the file ends up being overly complex and extremely large.
Because of this, we recommend rebuilding models every couple of years, if practical. This allows the model builder to rethink the layout and structure, which is especially important as business conditions change. Additionally, it allows the analyst to jettison the parts of the model or analyses that just aren’t useful anymore.
Archiving and file versioning
Depending on the company, the budgeting process can take upwards of several months per year. Because of this, FP&A professionals will likely go through multiple versions of the budget model. Therefore, archiving and file versioning is absolutely critical.
When archiving a file, we recommend using a description instead of version 1 (V1), version 2 (V2), etc. This is to better help a user find an older version of the model. V1 or V2 don’t mean anything but something like “Budget Model – revised R&D budget” is more helpful for analysts and searching.
Additionally, we recommend coming up with a standardized date convention. For example, when saving files you could use “YYYY-MM-DD” as the date convention (example: 2024-05-02). This will help eliminate ambiguity when looking at dates, especially between countries that might put the month before the day (like in the US) and countries that put the day before the month (like Europe or South America).
We also recommend keeping a “change log” detailing substantive changes made to the model. This could simply be a separate sheet in the model where the financial analysts can input a description of what substantive changes they made, as well as the date of those changes. We recommend only including major, substantive changes like adding a schedule, as opposed to just logging when an assumption or other input is changed.
Dealing with external data
Invariably, corporate financial analysts will need to use data from many different sources, and dealing with these sources can be quite cumbersome.
If you must use external links in Excel, we recommend you create a dedicated “Links” tab that pulls all of the data into one central location. This is in contrast to directly linking to external data in various different places in your model.
The below screenshot, while simple, is an example where the analyst linked the data directly to the external data source as part of the main model.

Not the recommended approach
If someone inserts a row in the file named “Central Data Source,” then the link will “break” and no longer pull in the correct data. Imagine if links like this are scattered throughout a really large model. Finding and correcting all of the links could be quite time-consuming!
Instead, we recommend having one dedicated area in a model where all external links are located. While the links can still be broken if the Central Data Source is changed, it’s easier to find and fix the broken links if they are all located in one area in a model.
In the following screenshot, we instead have all external links pulled into a single worksheet in our model titled “Links.” From there, we can pull in the same exact data as we did previously but with the added benefit of being able to quickly diagnose and correct any issues with the linked file and data.

Recommended approach
Also, keep in mind that when updating links and external data, you won’t automatically know what changed in your model, so proceed with caution. Because of this, we generally recommend that you avoid links to live, external data unless absolutely necessary.
Additional Resources
Thank you for reading CFI’s guide on FP&A Modeling Best Practices. To keep advancing your career, the additional CFI resources below will be useful:
Leveraging Generative AI for Financial Analysis
Additional Resources
CFI is a global provider of financial modeling courses and of the FMVA Certification. CFI’s mission is to help all professionals improve their technical skills. If you are a student or looking for a career change, the CFI website has many free resources to help you jumpstart your Career in Finance. If you are seeking to improve your technical skills, check out some of our most popular courses. Below are some additional resources for you to further explore:
The Financial Modeling Certification
Excel Tutorial
CFI is a global provider of financial modeling courses and of the FMVA Certification. CFI’s mission is to help all professionals improve their technical skills. If you are a student or looking for a career change, the CFI website has many free resources to help you jumpstart your Career in Finance. If you are seeking to improve your technical skills, check out some of our most popular courses. Below are some additional resources for you to further explore:
The Financial Modeling Certification
to take your career to the next level and move up the ladder!
Create a free account to unlock this Template
Access and download collection of free Templates to help power your productivity and performance.
Already have an account? Log in
Supercharge your skills with Premium Templates
Take your learning and productivity to the next level with our Premium Templates.
Upgrading to a paid membership gives you access to our extensive collection of plug-and-play Templates designed to power your performance—as well as CFI's full course catalog and accredited Certification Programs.
Already have a Self-Study or Full-Immersion membership? Log in
Access Exclusive Templates
Gain unlimited access to more than 250 productivity Templates, CFI's full course catalog and accredited Certification Programs, hundreds of resources, expert reviews and support, the chance to work with real-world finance and research tools, and more.
Already have a Full-Immersion membership? Log in


