Overview
Power Pivot Fundamentals Course Overview
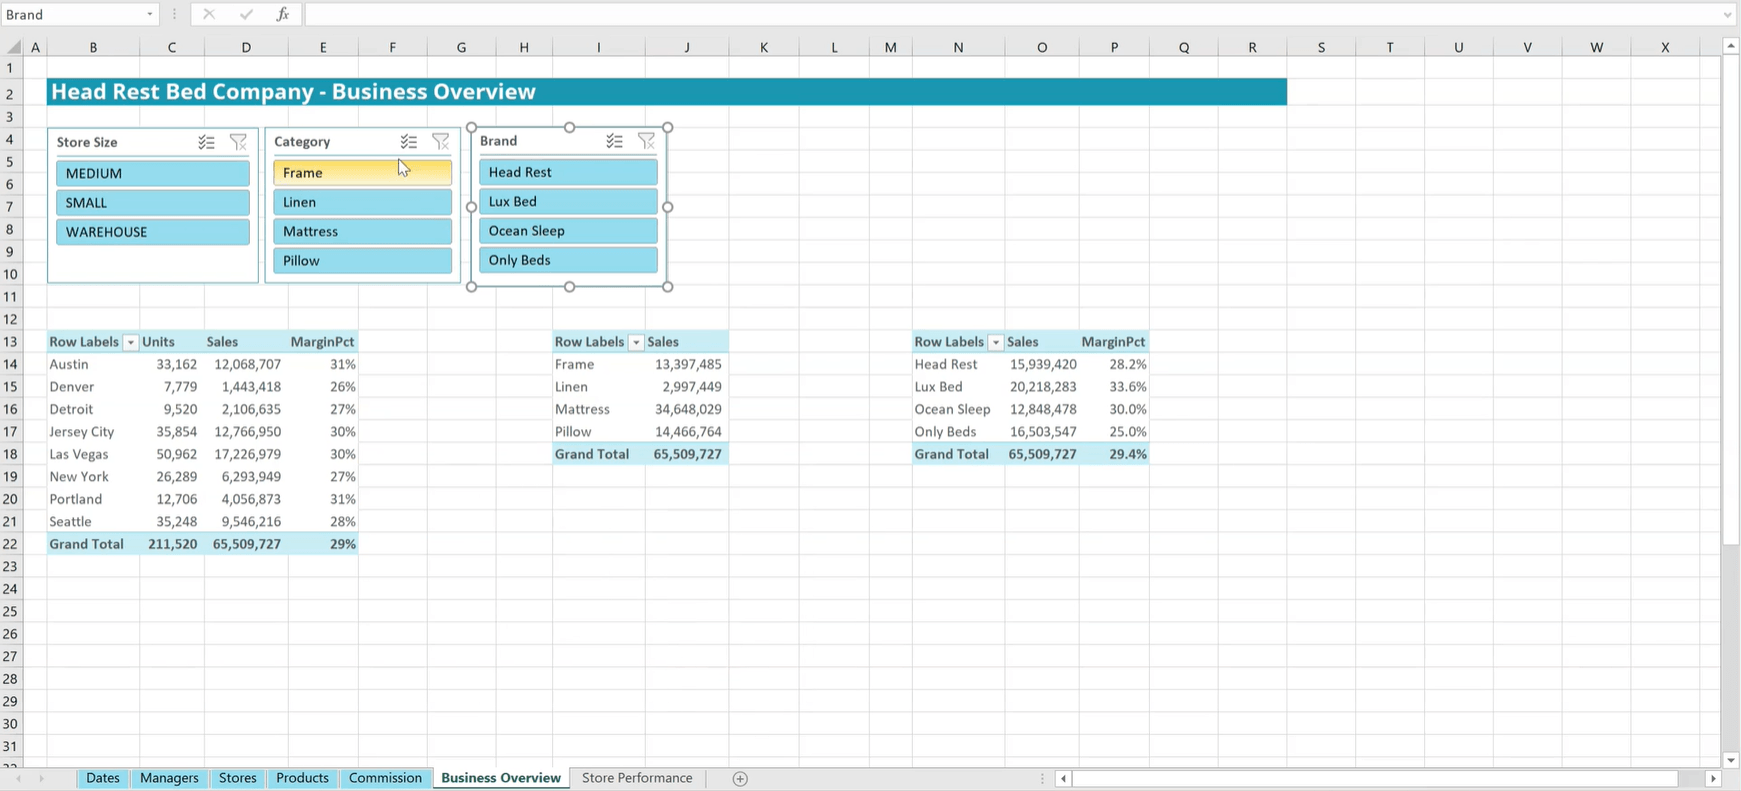
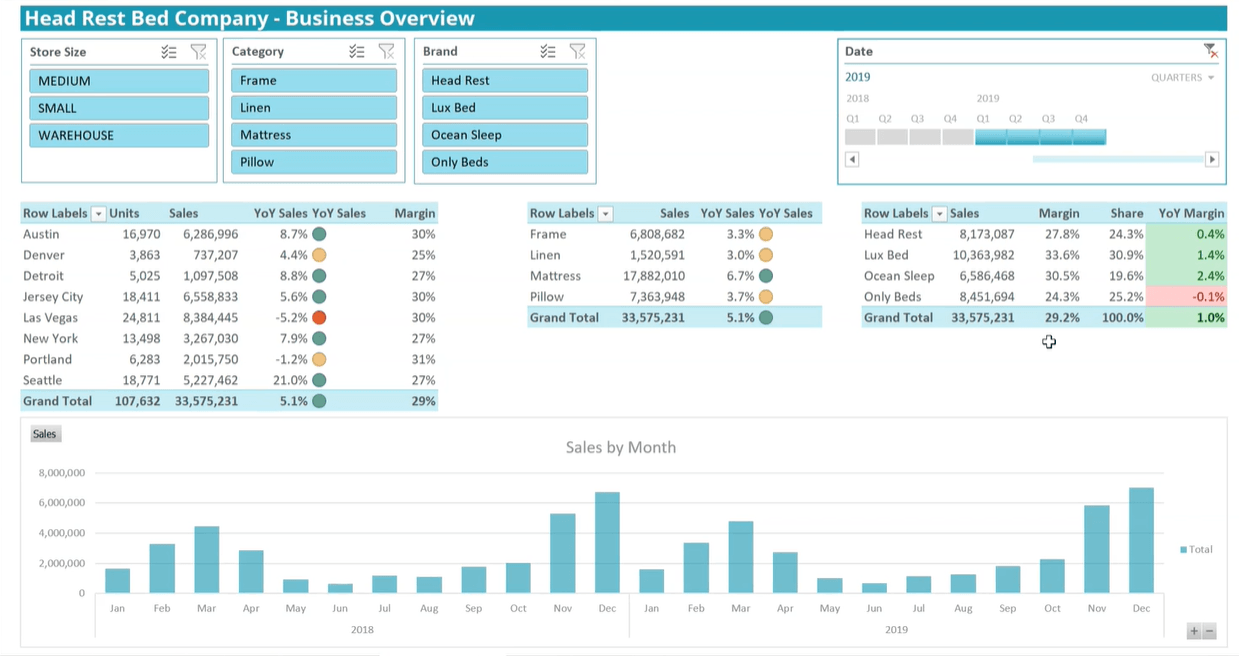
Discover the full potential of Excel with our Power Pivot course, designed to elevate your data analysis and presentation skills. You’ll learn how to utilize the Power Pivot add-on to create sophisticated business intelligence dashboards with PivotTables and PivotCharts. This course offers step-by-step instructions on setting up dashboards, covering essential functions and best practices that cater to both beginners and experienced users.
As the course progresses, you’ll engage in a hands-on project using provided data sets, applying your newfound skills to build a comprehensive dashboard. By the end of this journey, you’ll have the knowledge and confidence to construct your own Excel dashboards. These skills will enable you to effectively analyze data, track key performance indicators (KPIs), and make compelling time-period comparisons, transforming data into actionable insights.
Power Pivot Fundamentals Learning Objectives
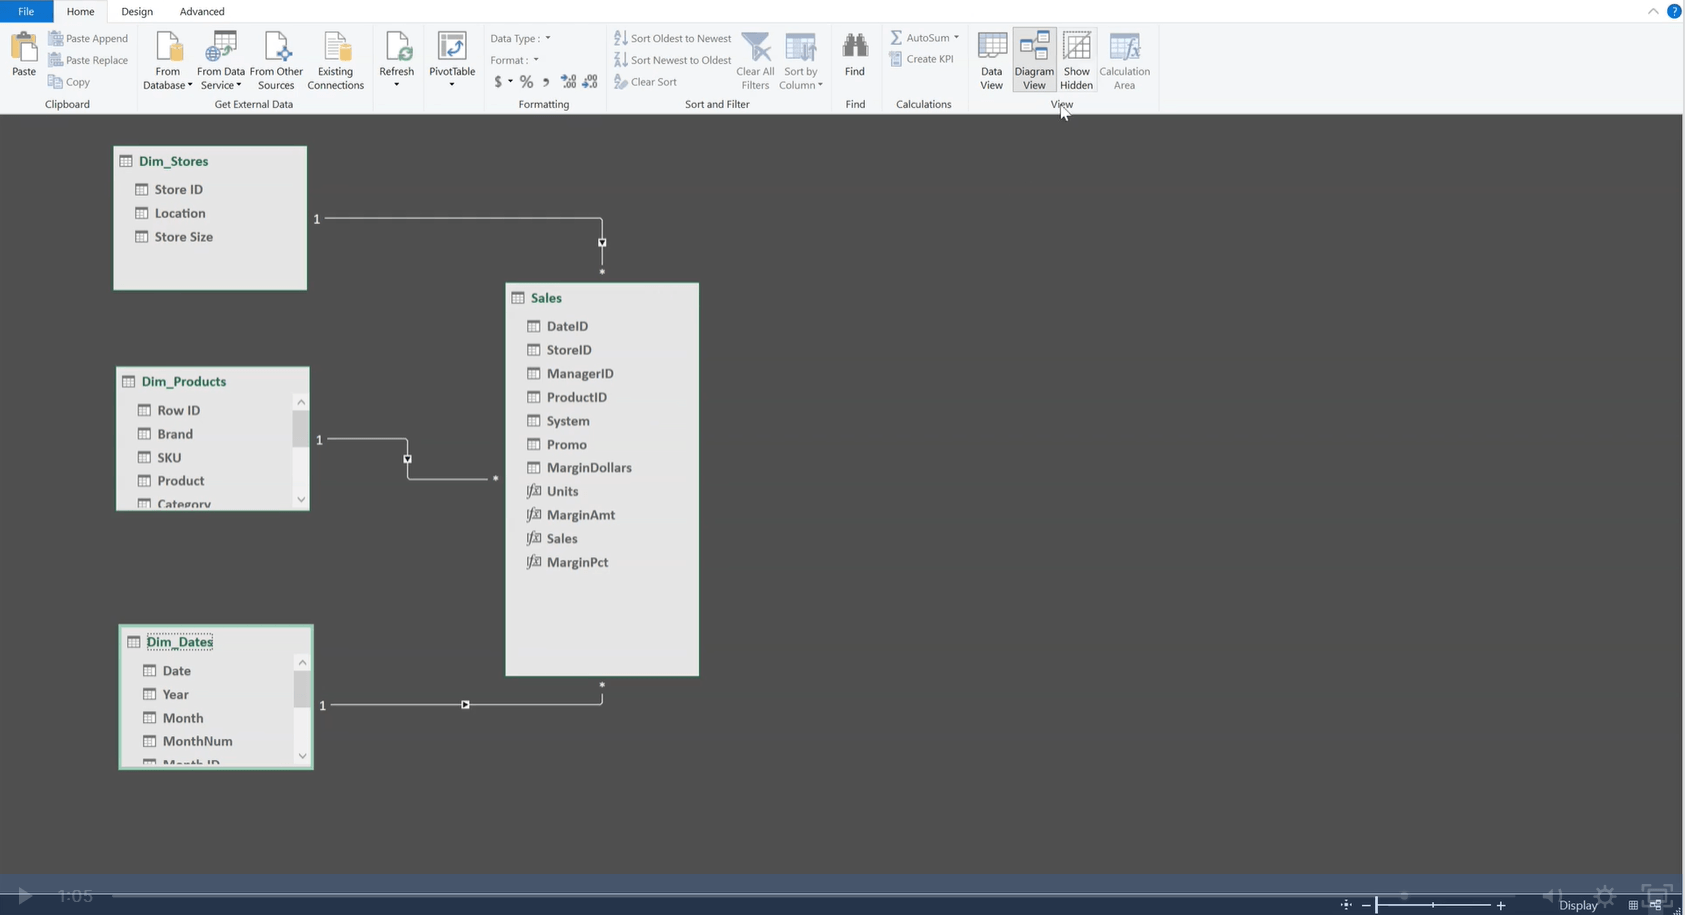
Upon completing this course, you will be able to:- Create a Power Pivot table by drawing data from several different tables
- Develop simple calculated metrics with consistent formatting
- Assemble multiple pivot tables, charts, and dimensions into a dashboard that provide us with different angles of analysis
- Manipulate context to calculate more advanced metrics
- Utilize DAX Advanced Time Intelligence to create period comparisons and KPIs
Who should take this course?
This course is perfect for Excel users looking to step into business intelligence, analysts who depend on Excel, and any data professional eager to improve their data handling and visualization skills. It’s designed to enhance your Excel capabilities, equipping you with the tools to turn complex data into clear, insightful dashboards.
Software requirements
As of 2020, Power Pivot functionality is not available for the Mac version of Excel. Because of this students must use Windows to complete this training.Power Pivot Fundamentals
Level 3
Approx 4h to complete
100% online and self-paced
Get StartedWhat you'll learn
A Basic Data Model
Basic Measures
Working with a Star Schema
From Numbers to Narratives
Extended Practice
Course Summary
Qualified Assessment
This Course is Part of the Following Programs
Why stop here? Expand your skills and show your expertise with the professional certifications, specializations, and CPE credits you’re already on your way to earning.
Financial Modeling & Valuation Analyst (FMVA®) Certification
- Skills Learned Financial modeling and valuation, sensitivity analysis, strategy
- Career Prep Investment banking and equity research, FP&A, corporate development
Business Intelligence & Data Analyst (BIDA®) Certification
- Skills Learned Data visualization, data warehousing and transformation, data modeling and analysis
- Career Prep Business intelligence analyst, data scientist, data visualization specialist
Data Analysis in Excel Specialization
- Skills Learned Data Modelling & Analysis, Data Transformation, Data Visualization
- Career Prep Data Analyst, Business Intelligence Specialist, Data Scientist, Finance Analyst
Business Intelligence Analyst Specialization
- Skills learned Data Transformation & Automation, Data Visualization, Coding, Data Modeling
- Career prep Data Analyst, Business Intelligence Specialist, Finance Analyst, Data Scientist

